In 2016, solar installations set new records and this year state governments, utilities, and private businesses were eager to continue the trend. But where are they? Surprisingly, until now there was no central database showing the locations of solar installations. On Wednesday, researchers from Stanford announced that they have developed a database of solar installations in the U.S., something which will allow for further study of how policy and market pressures are impacting the adoption of solar generation.
“We can use recent advances in machine learning to know where all these assets are, which has been a huge question, and generate insights about where the grid is going and how we can help get it to a more beneficial place,” said Ram Rajagopal, associate professor of civil and environmental engineering, who supervised the project.
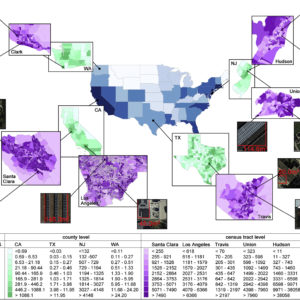
The researchers developed a machine learning algorithm that could identify solar panels in satellite images. After providing the program with some 370,000 images, each covering a space of about 100 ft by 100 ft, and marked as containing or not containing a solar panel, the system was able to correctly identify solar panels in 93 percent of cases by identifying features like color, texture, and size, that are associated with solar panels.
This gave them a comprehensive data set covering not only solar panels installed in utility scale solar power plants, but also panels installed on the roofs of homes and businesses. Additionally, they integrated Census data with their database to identify other factors, such as income levels, which impact solar deployment.
Some of the trends they discovered were expected. Solar installations are most common in the south and southwest, with states like California, Arizona, and Nevada leading the trend. Installations were much less prevalent in the Midwest, and very rare in rural states in the Mountain West, including Montana, Idaho, and Wyoming.
Other factors, such as the impact of income levels, had a more nuanced impact. According to the study, higher-income households are more likely to install solar panels than lower or median income households–at least until the $150,000 point. After that, additional income does not increase the likelihood of a solar panel installation.
“Annual household income is a substantial driver for solar deployment,” the researchers wrote. “Low- and medium-income households have low deployment densities despite solar systems being profitable for high-radiation rates, indicating that the lack of financial capability of covering the upfront cost is likely a major burden of solar deployment.”
By focusing on household incomes and weather patterns, the study provides additional context to a debate that frequently centers around government policy. Through programs like renewable energy tax credits and renewable portfolio standards are helping solar growth, income levels also play a role.
“We found some insights, but it’s just the tip of the iceberg of what we think other researchers, utilities, solar developers and policymakers can further uncover,” said Arun Majumdar, a mechanical engineering professor who also supervised the project. “We are making this public so that others find solar deployment patterns, and build economic and behavioral models.”
The researchers are making their data set publicly available to “empower the community to uncover further insights” and the industry is welcoming the additional information.
“I believe there is certainly data in here that can help supplement resource planning analytics and how/where solar installations are angled and oriented,” Alex Hobson, director of external communications for the Solar Energy Industries Association (SEIA) told InsideSources.
For both the solar and utility industries, having a broad picture of where panels are being placed helps with future reliability planning and grid construction. This data also raises questions about what drives growth in the industry–government policy or electricity prices?
“From watching the solar industry’s massive growth over the last 5-10 years, it’s clear that policy is a critical driver. From renewable portfolio standards (RPS) to smart net metering policies, the top states for solar all have some form of strong solar policy on the books, and the data shows it pays off in dividends in jobs and investment dollars,” Hobson said.
Through a combination of tax credits, rebates, and renewable energy credits, states like Arizona have been able to make clean energy more cost effective for their citizens. As the study shows, many areas of the country have yet to adopt widescale solar power, though.
“Over the next five years, the US solar market is expected to double in size. States like Illinois and its neighbors in the Midwest are primed for more solar deployment as policies like the Future Energy Jobs Act and community solar programs are implemented,” he continued. “States in the South like Florida, Texas and South Carolina are all expected to see impressive growth. And with the recent approval of the solar mandate for all new homes, California is poised to continue its impressive solar trajectory.”
That buildout is ambitious and will create technical complications of its own. Much of the U.S. electric grid was built to carry power from central generators to consumers. Solar power, which can be installed in residential areas, means that generation can be dispersed with power flowing from homes back into the rest of the grid. Planning for these next generation developments is already underway and data like that of the Stanford study will play an important role.